Note
Go to the end to download the full example code.
UpSet Plot
This example demonstrates the UpSet plot for visualizing feature interactions. The UpSet plot shows the most important interactions as vertical bars with the interacting features in a matrix below.
from __future__ import annotations

from sklearn.model_selection import train_test_split
from xgboost import XGBRegressor

import shapiq
Train a Model and Compute Explanations
x_data, y_data = shapiq.datasets.load_california_housing(to_numpy=False)
feature_names = list(x_data.columns)
x_data, y_data = x_data.values, y_data.values
x_train, x_test, y_train, y_test = train_test_split(
    x_data,
    y_data,
    test_size=0.2,
    random_state=42,
)
model = XGBRegressor(random_state=42, max_depth=4, n_estimators=50)
model.fit(x_train, y_train)

x_explain = x_test[2]
explainer = shapiq.TabularExplainer(
    model,
    data=x_test,
    index="FSII",
    max_order=2,
    random_state=42,
)
explanation = explainer.explain(x_explain, budget=200)
print(explanation)
InteractionValues(
    index=FSII, max_order=2, min_order=0, estimated=True, estimation_budget=200,
    n_players=8, baseline_value=2.058321475982666,
    Top 10 interactions:
        (): 2.058321475982666
        (7,): 1.3230916324591264
        (5,): 0.4139658411932039
        (6, 7): 0.31170785369578036
        (1, 7): 0.26777322337240667
        (2, 5): 0.21734111653874785
        (1,): 0.1495934102699914
        (1, 5): 0.14086924498992803
        (0,): -0.20034258588547618
        (6,): -0.5329539880748719
)
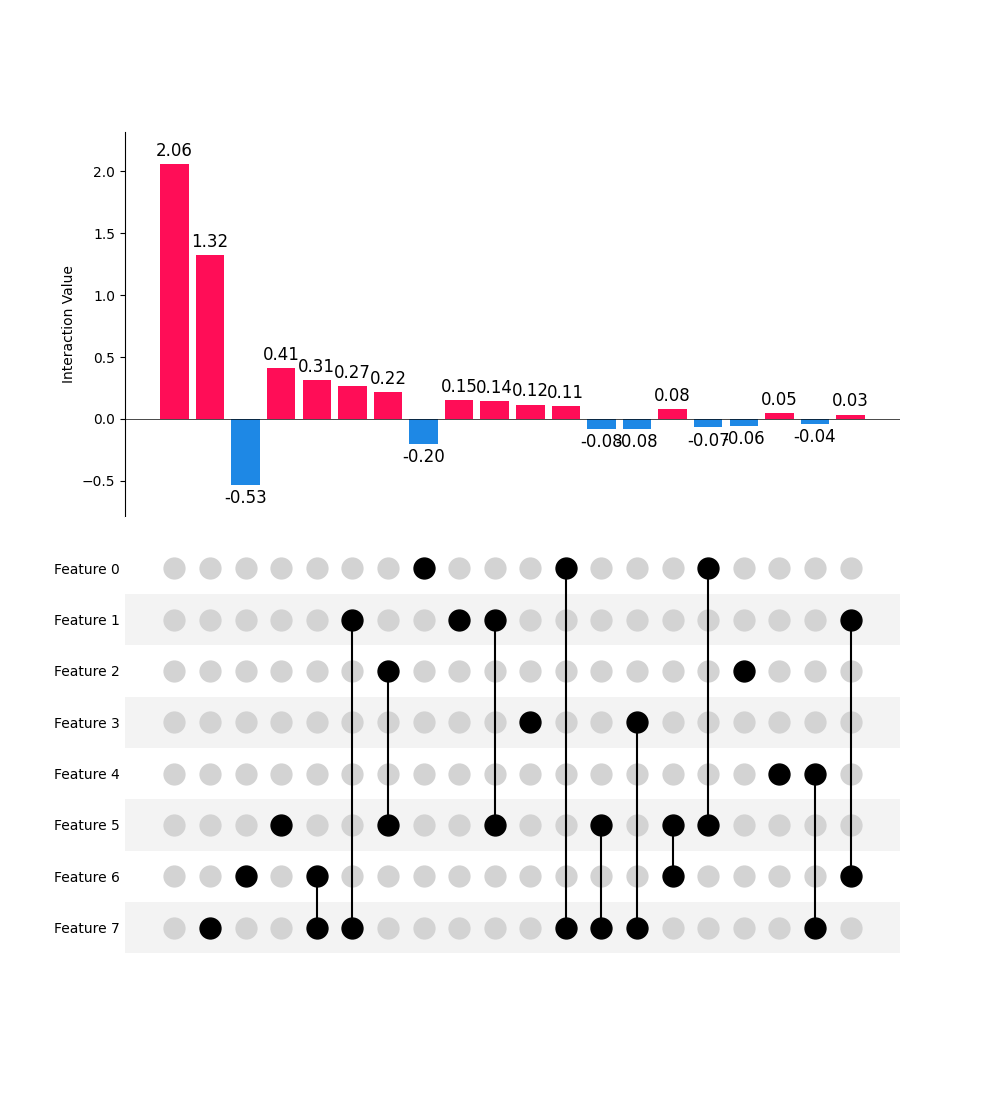
Basic UpSet Plot
explanation.plot_upset()
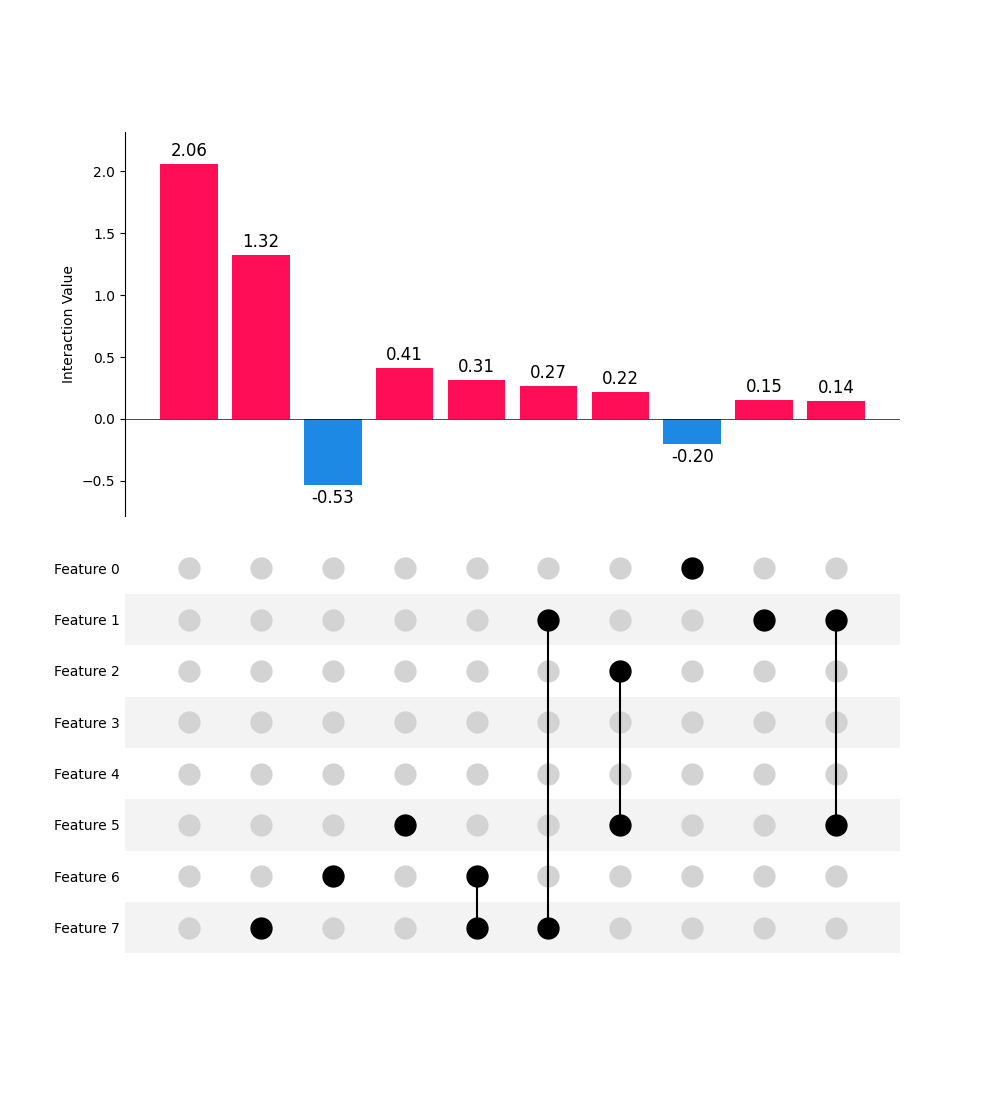
Customization: Number of Interactions
explanation.plot_upset(n_interactions=10)
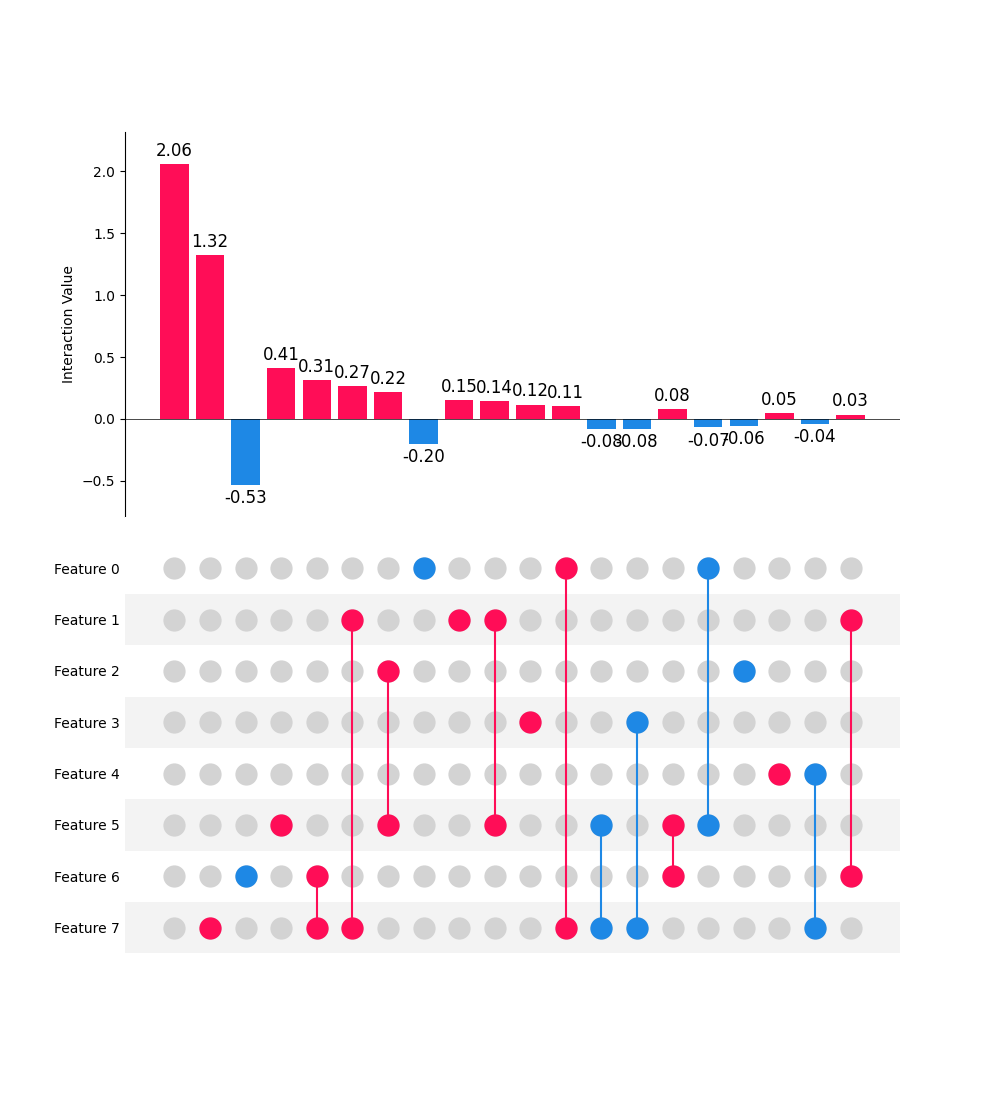
Color the Matrix
Color-code the matrix based on interaction sign (red = positive, blue = negative).
explanation.plot_upset(color_matrix=True)
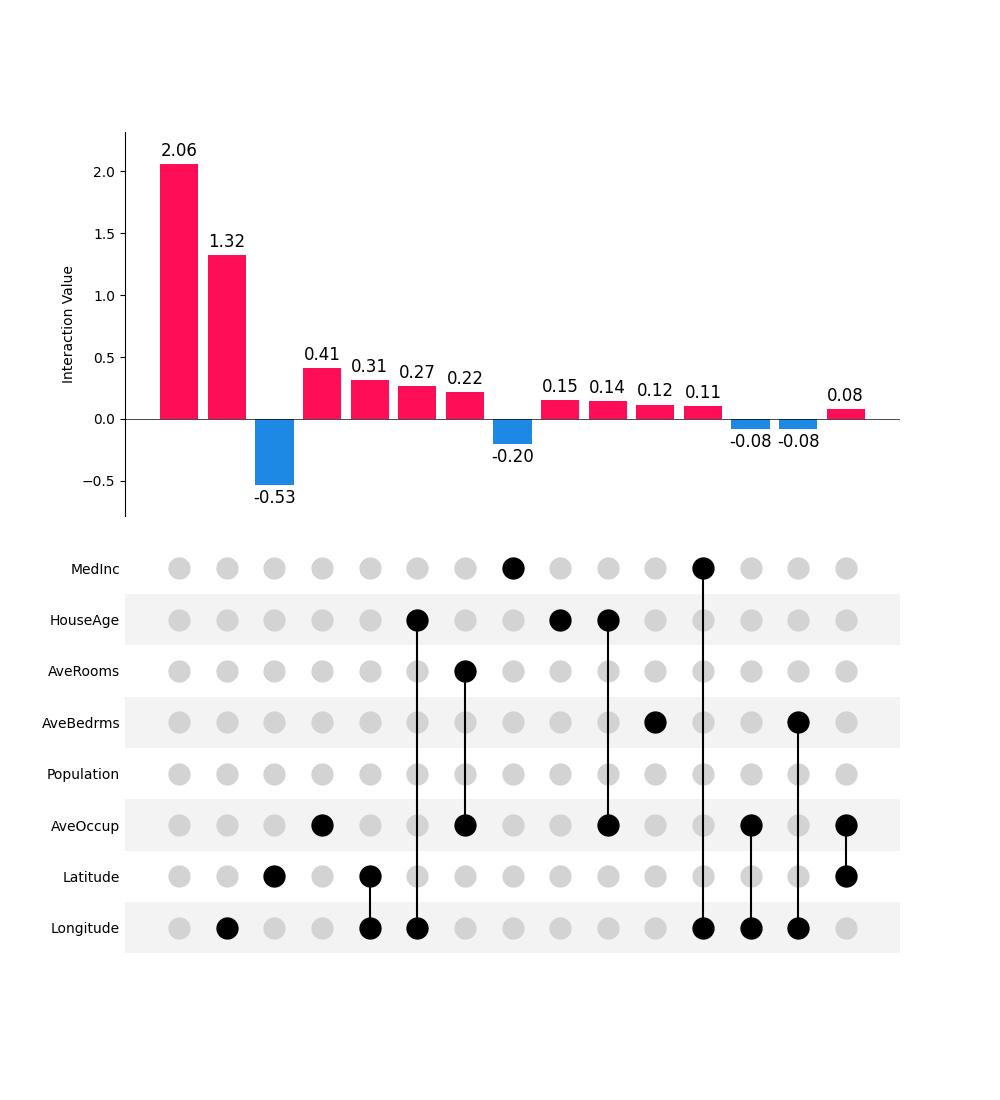
Feature Names
explanation.plot_upset(feature_names=feature_names, n_interactions=15)
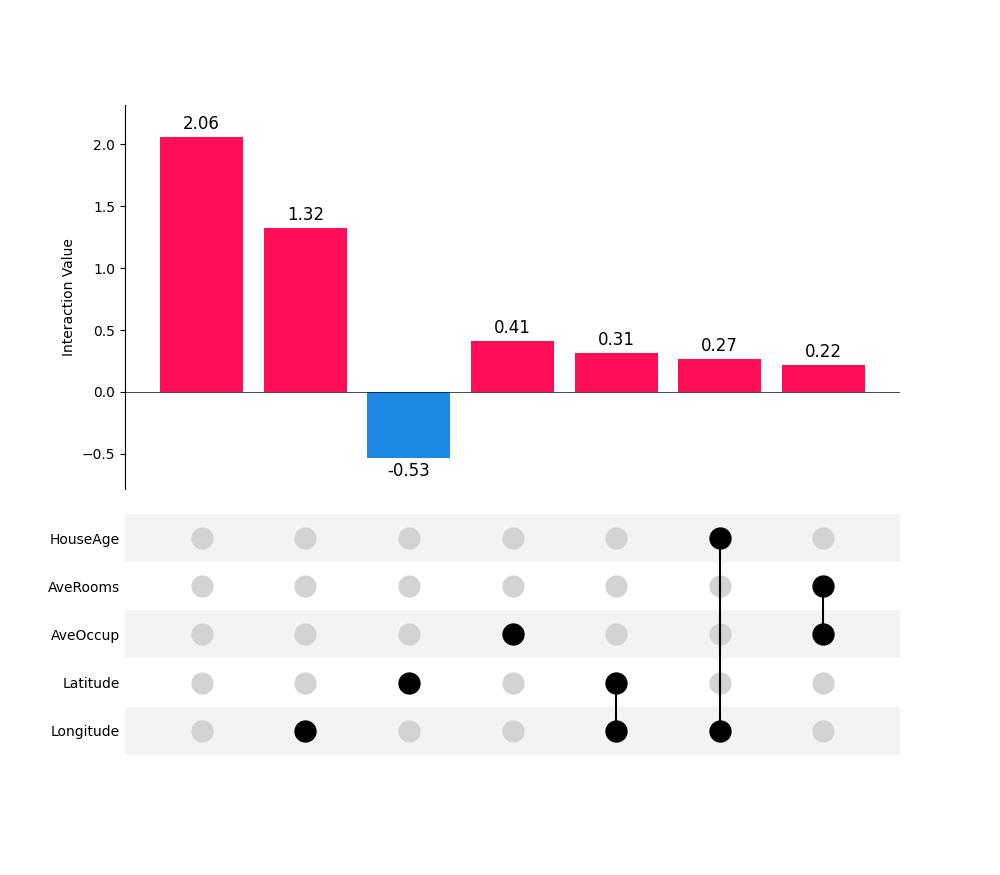
Show Only Relevant Features
Set all_features=False to show only features present in the top interactions.
explanation.plot_upset(all_features=False, n_interactions=7, feature_names=feature_names)
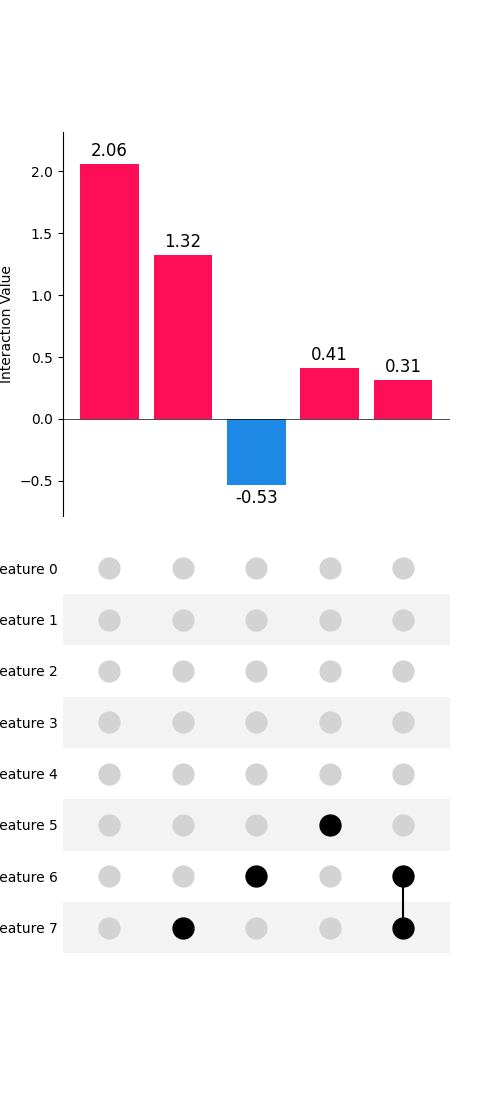
Adjust Figure Size
explanation.plot_upset(n_interactions=5, figsize=(5, None))
Total running time of the script: (0 minutes 0.934 seconds)