Note
Go to the end to download the full example code.
Beeswarm Plot
This example demonstrates beeswarm_plot(), which provides a
global perspective on feature interactions by plotting interaction values
across multiple instances, colored by feature value.
from __future__ import annotations

import matplotlib.pyplot as plt
from sklearn.model_selection import train_test_split
from xgboost import XGBRegressor

import shapiq
Train a Model
x_data, y_data = shapiq.datasets.load_california_housing(to_numpy=False)
feature_names = list(x_data.columns)
x_data, y_data = x_data.values, y_data.values
x_train, x_test, y_train, y_test = train_test_split(
    x_data,
    y_data,
    test_size=0.2,
    random_state=42,
)
model = XGBRegressor(random_state=42, max_depth=4, n_estimators=50)
model.fit(x_train, y_train)
XGBRegressor(base_score=None, booster=None, callbacks=None,
             colsample_bylevel=None, colsample_bynode=None,
             colsample_bytree=None, device=None, early_stopping_rounds=None,
             enable_categorical=False, eval_metric=None, feature_types=None,
             feature_weights=None, gamma=None, grow_policy=None,
             importance_type=None, interaction_constraints=None,
             learning_rate=None, max_bin=None, max_cat_threshold=None,
             max_cat_to_onehot=None, max_delta_step=None, max_depth=4,
             max_leaves=None, min_child_weight=None, missing=nan,
             monotone_constraints=None, multi_strategy=None, n_estimators=50,
             n_jobs=None, num_parallel_tree=None, ...)
In a Jupyter environment, please rerun this cell to show the HTML representation or trust the notebook. On GitHub, the HTML representation is unable to render, please try loading this page with nbviewer.org.
Parameters
Compute Explanations for Multiple Instances
We explain 20 test instances to keep the example fast.
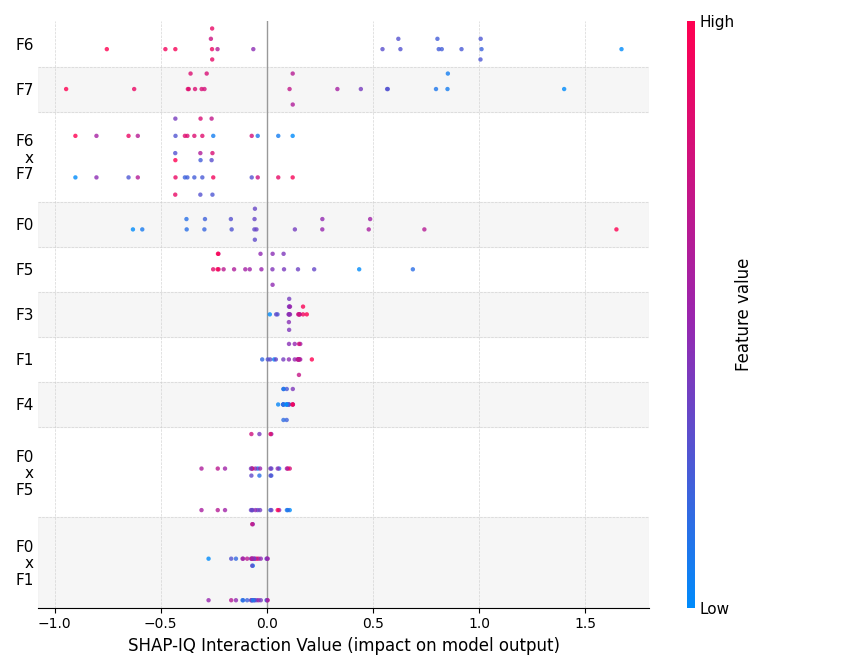
Basic Beeswarm Plot
shapiq.beeswarm_plot(explanations, x_explain)
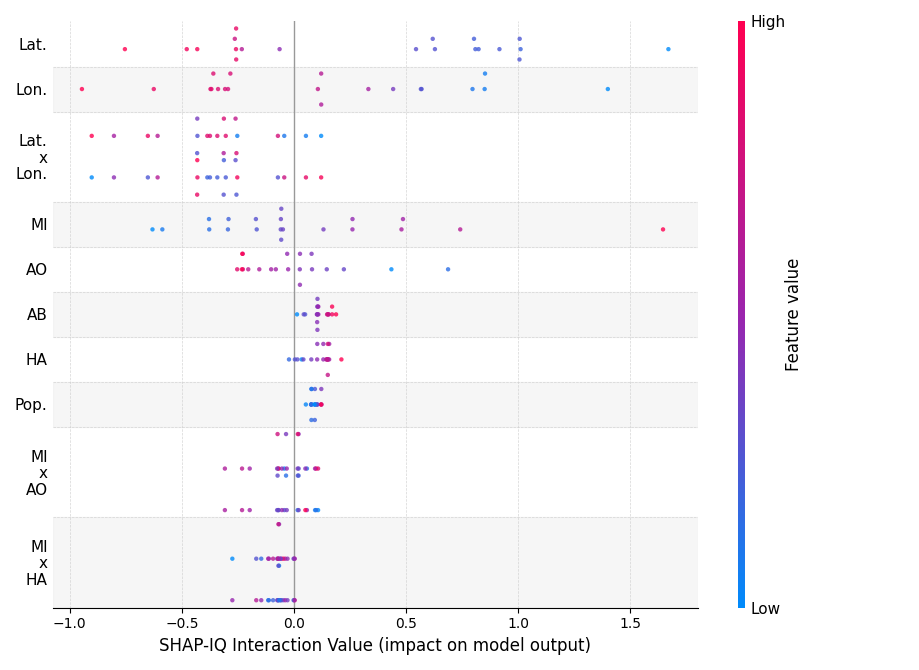
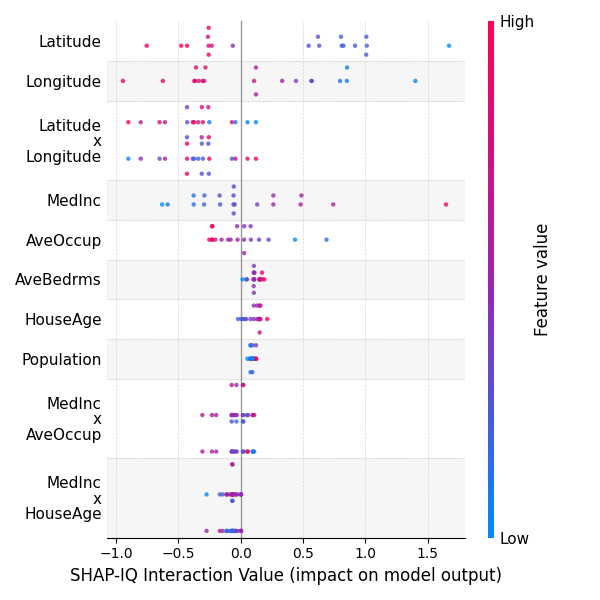
With Feature Names
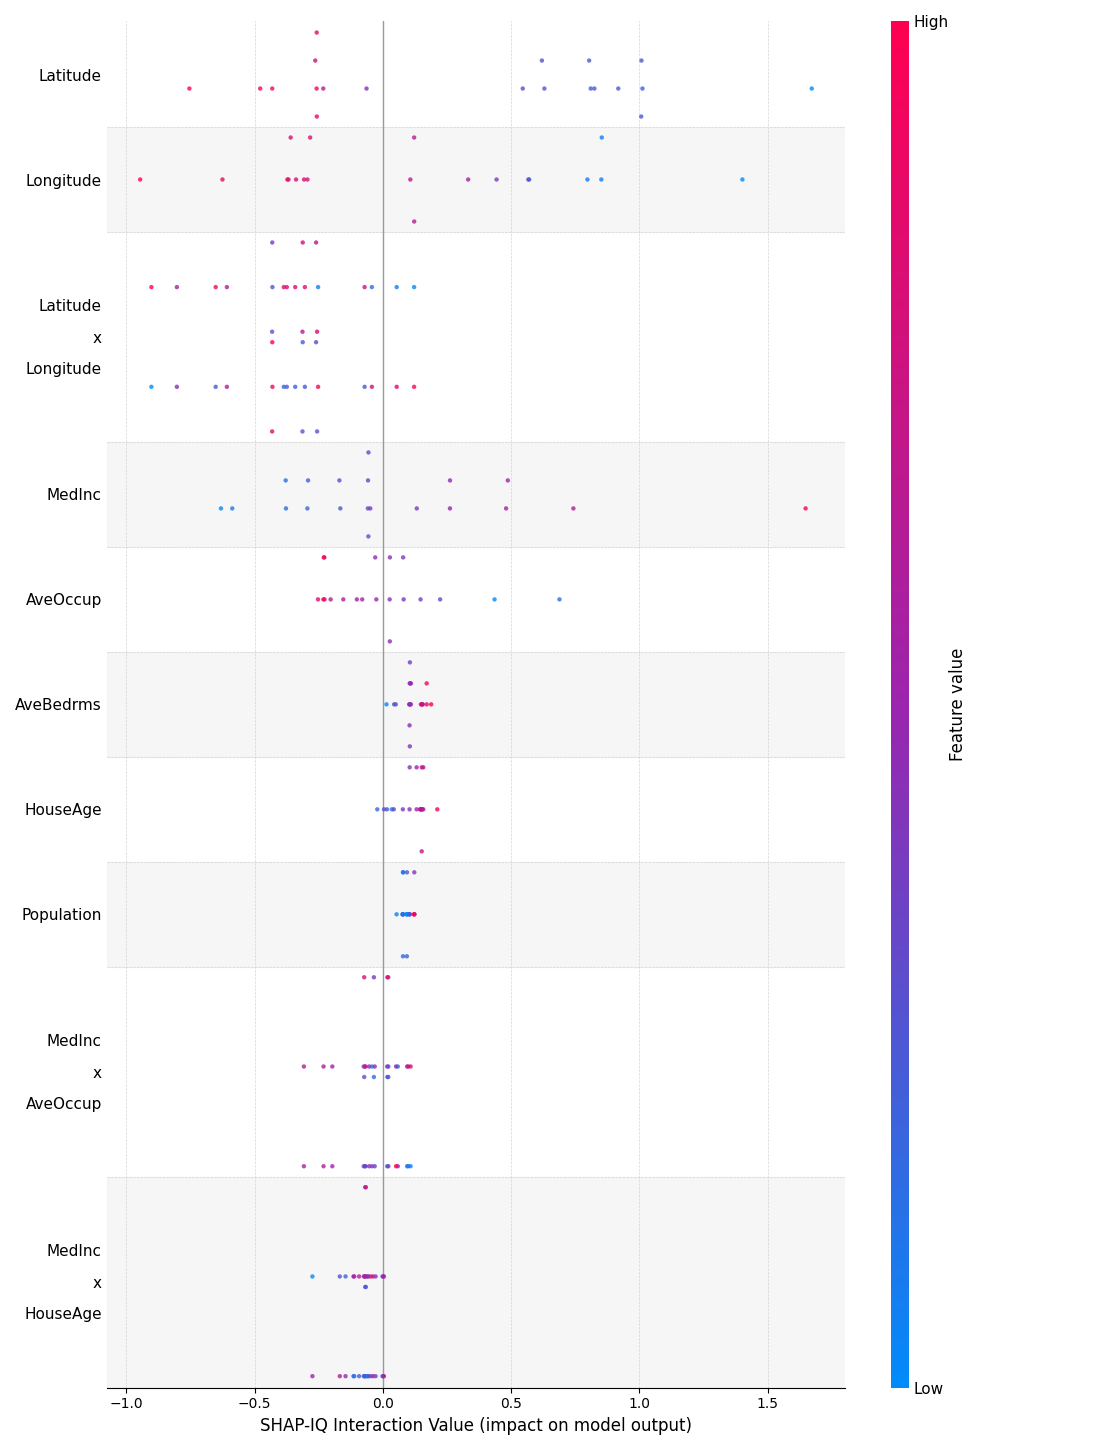
shapiq.beeswarm_plot(explanations, x_explain, feature_names=feature_names)
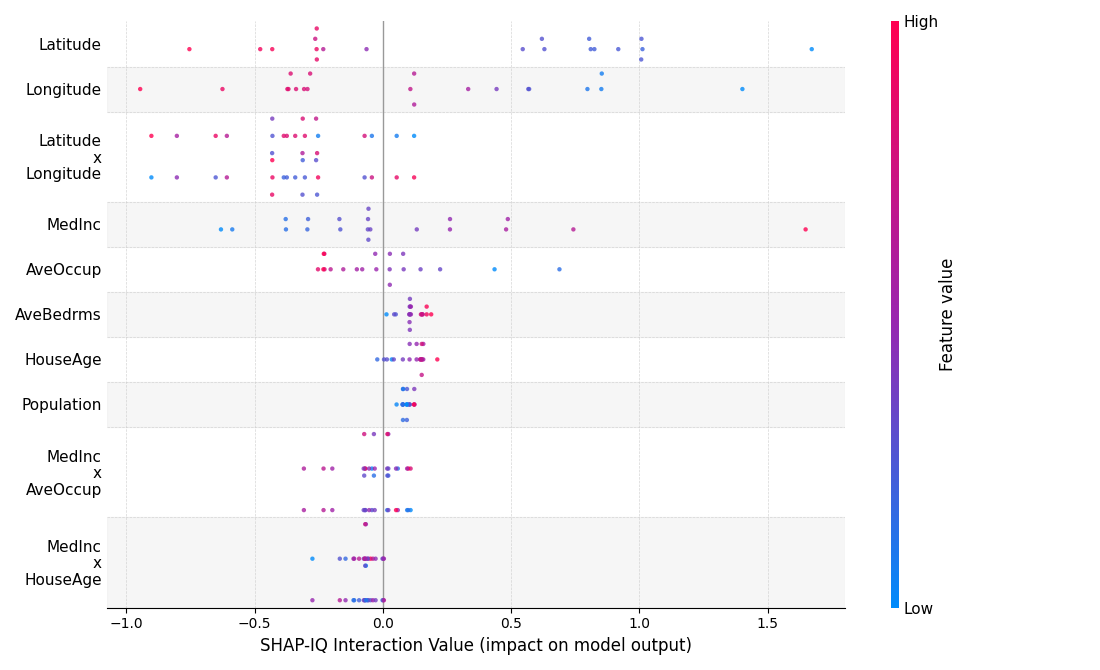
Full Feature Names (no abbreviation)
shapiq.beeswarm_plot(
    explanations,
    x_explain,
    feature_names=feature_names,
    abbreviate=False,
)
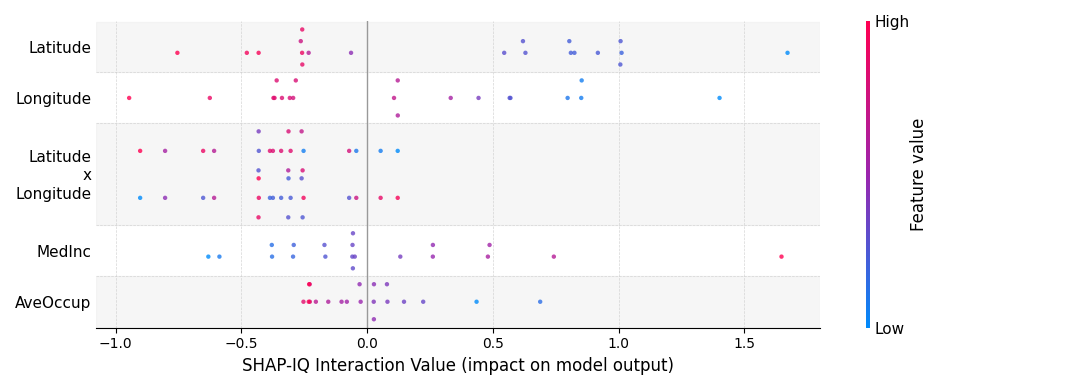
Limit Displayed Interactions
shapiq.beeswarm_plot(
    explanations,
    x_explain,
    feature_names=feature_names,
    abbreviate=False,
    max_display=5,
)
Adjust Row Height
shapiq.beeswarm_plot(
    explanations,
    x_explain,
    feature_names=feature_names,
    abbreviate=False,
    row_height=1.0,
)
Custom Axis
Total running time of the script: (0 minutes 3.025 seconds)